Screencap showing the output of cross validation
There are several methods for estimating how well your behavior classifier is working. The first method you should use is to examine the classifier's predictions on frames different from the training data. Machine learning classifiers will perform very well on the labeled data they were trained on, well on data similar to the labeled data, and not well on data very different from the training data. Thus, we recommend seeking to and examining the classifier's predictions for different parts of the video for the current fly, different flies, and different videos. See Navigating within and between Videos.
The most complete, but most labor-intensive method for evaluating a behavior classifier is to Ground Truth it. That is, to manually label frames outside of the training data while not looking at JAABA's predictions, and compare these manual labels to JAABA's predictions. We describe how to ground truth a classifier here.
Cross Validation is a quick way to quantitatively measure the classifier's accuracy on frames outside the training data set. In cross validation, a subset of the training data is held out for testing and the rest of the training data is used for training. In k-fold cross validation, 1/k of the training data is held out for testing and the testing is done k times so that each training example gets tested once.
Select the Classifier -> Cross Validate menu item to perform cross validation with the current set of labeled data.
In JAABA, cross validation is done over bouts, i.e., either the whole labeled bout will be part of the training set or it will be part of the test set. By default, JAABA does 7-fold cross validation, thus you need at least 7 bouts each of the behavior and not-behavior to do cross validation.
After cross validation is performed, it returns a table showing the types of errors the classifiers made. The columns of the table correspond to the classifiers' predictions, and the rows correspond to the manual labels. Each element of the table corresponds to the number and (percent) of frames with the given type of manual labels that have the given prediction. Percentages are computed over rows.
The columns are:
The rows are:
The bottom 4 rows have the same format as the top 4 rows, but the cross-validation numbers are computed only for the old labels. Old labels are the labels that were used to train the classifier just before the current classifier in the current JAABA session. Comparing the cross validation error rates on old labels gives the user an idea how much the addition of new labels has improved the performance as compared to the previous training set.
Cross validation can, in some cases, give an underestimate of the accuracy of the classifier. Suppose that you trained a classifier, found a bout of frames for which its prediction was incorrect, and labeled these frames. These frames will almost certainly be classified incorrectly during cross validation because the training set used to predict these frames will be a subset of the training set used to train the original classifier.
The predictions and scores for all the labeled frames produced using cross validation can be displayed at the bottom of the scores timeline by selecting Cross validation from the drop-down menu left of the scores timeline. Note that cross validation is done using the labels that were used to train the latest classifier. Labels added after training a classifier are not used to in cross validation.

JAABA uses the boosting learning algorithm to train a behavior classifier. Boosting works by combining many simple rules that are typically not very accurate on their own into one accurate rule. In JAABA, we use decision stumps as the simple rules. Decision stumps predict by simply comparing a window feature's value to a threshold. As JAABA computes and examines a large number of window features, combining these simple decision stumps is quite effective in learning an accurate detector.
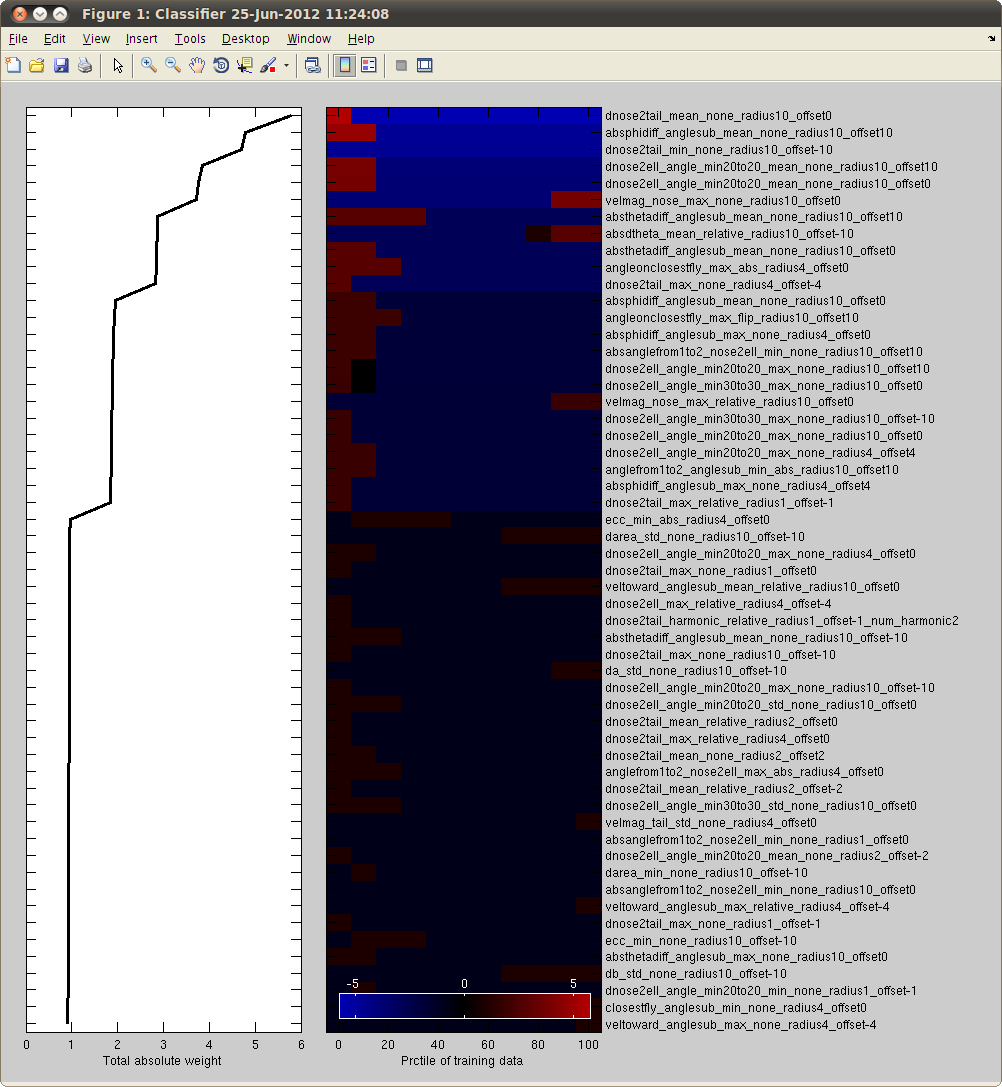
Because of the simplicity of the weak rules, it is possible to visualize the classifier by looking at the window features it uses. When you select the menu item Classifier -> Visualize Classifier, it will create a figure showing
Below is an example output. The features are ordered in descending order of the weight that was placed on it. The feature names are listed on the right. The parts of the feature names are (in order):
The left plot shows the weight (y-axis) that is given to each feature (x-axis) by the boosting algorithm. The middle plot shows the predictions of the classifier based on each feature on its own. To put all the features on the same axis, we plot the predictions in terms of percentiles of the feature value observed (x-axis).
