After importing data with PrepareJAABAData, and training a classifier with StartJAABA, one can then classify and visualize large data sets with JAABAPlot
Multiple movies / experiments can be divided into an arbitrary number of groups for multi-variate analysis.
Use the New button to create a group and give it a name and color. The name and color can subsequently be altered using the Change button.
Use the Add button to browse for experiments to add to the current group. Multiple experiments can be selected at once by shift- or control-clicking.
Alternatively, put a list of experiment directories on separate lines of a text file and use the Batch button. If each experiment directory is followed by a comma and then the corresponding group name, new groups are automatically created. Group color can be specified by an additional comma and a hexidecimal color code. For example:
/my/nobel/prize/data/experiment1,control,FF0000
/my/nobel/prize/data/experiment2,control,FF0000
/my/nobel/prize/data/experiment3,control,FF0000
/my/nobel/prize/data/experiment4,group1,00FF00
/my/nobel/prize/data/experiment5,group1,00FF00
/my/nobel/prize/data/experiment6,group1,00FF00
/my/nobel/prize/data/experiment7,group2,0000FF
/my/nobel/prize/data/experiment8,group2,0000FF
/my/nobel/prize/data/experiment9,group2,0000FF
To delete experiments first select them by (shift/control) clicking and then press the Delete button. Deleting all of the experiments in a group will also delete the group itself.
Transfer selected experiments from one group to another with the Move button.
To temporarily omit one or more experiments from the analysis without deleting them simply de-select them by (shift/control) clicking.
The features analyzed are only those common to all of the current experiments.
Experiment lists and other settings are maintained from one session to the next by automatically saving the configuration to most_recent_config.mat. Multiple different configurations can be maintained under different names using the Load and Save buttons.
The Reset button deletes all groups and experiments and returns all settings to their defaults.
Experiments can be annotated with multiple classifiers to compare populations with different behaviors.
Use the Add button to navigate to a classifier's project file. Multiple classifiers can be selected at once by shift- or control-clicking. Remove selected classifers with the Delete button.
Project filenames can also be put into a text file and loaded all at once with the Batch button.
If the experiments have already been classified, then project files can be found based on information contained in the scores files using the Auto button.
Use the Check button to compare the classifier list with the existing scores files in the listed experiment directories. A table will open in a new window, and be save to most_recent_table.csv.
Use the Classify button if some of the experiments have not been classified or are out of date. Control click (right click in Windows) to choose whether to classify all the experiments or just those needed.
Features extracted during tracking can be analyzed over all frames, during just a specific behavior, or as a function of time. Each experiment is considered one sample.
Histograms can be made of feature values during a behavior. Corresponding histograms for all of the feature values in the recording, or just those not during the behavior, can be optionally overlayed for comparison.
Click on the Feature Histogram button and set the following parameters:
Click on the Plot button and a new window will open with the requested analysis plotted. A text file named most_recent_figure.csv is also created containing the raw and processed data.
The Params button in each figure opens a new window showing the parameters used to create the data in that figure.
The Stats button in each figure opens a new window showing parametric and non-parametric comparisons between groups.
Multiple figure windows can be simultaneously closed with the Close All button.

Click on the Feature Histogram button and set Style to Box Plot. The same parameters are used to extract the same data as for the histograms above.

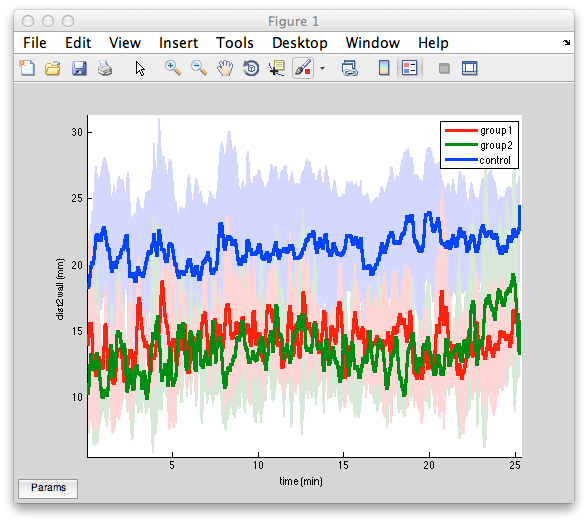
Feature values for every frame in the recording can be plotted consecutively, irrespective of any annotated behaviors. Alternatively, short snippets in time around the start and end of each bout of behavior can be aligned and overlayed.
For the former, click on Feature Histogram, choose Entire Recording from the right pull-down Style menu, and set the following parameters:
For the latter, click on Feature Histogram, choose Onset Triggered or Offset Triggered from the right pull-down Style menu, and set the following parameters:
In each case generate the figure and most_recent_figure.csv by clicking on the Plot button. A Params button is on this figure as well.
The fraction of time each behavior is performed can be analyzed in aggregate or as a time series. Each experiment is considered one sample.
Click on the Behavior Bar Chart button and set the following parameters:
Generate the figure and most_recent_figure.csv by clicking on the Plot button.
A Params button, and for certain styles a Stats button, are on these figures as well.


Click on the Behavior Time Series button and set the following parameters:
Click on the Plot button

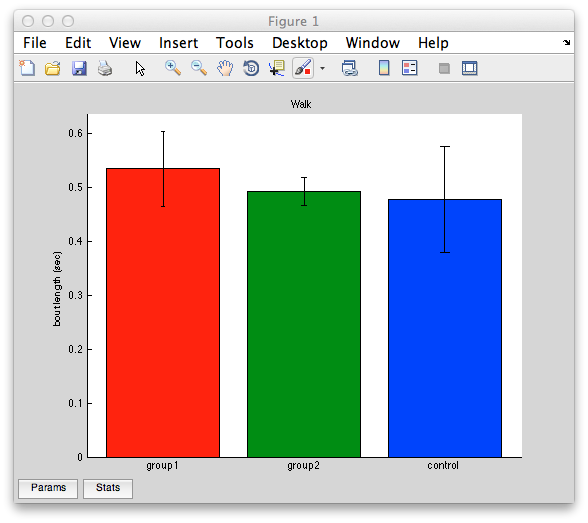
The duration of each bout of behavior can be quantified on a per-group or per-fly basis.
Click on the Bout Stats button and set the following parameters:
Click on the Plot button
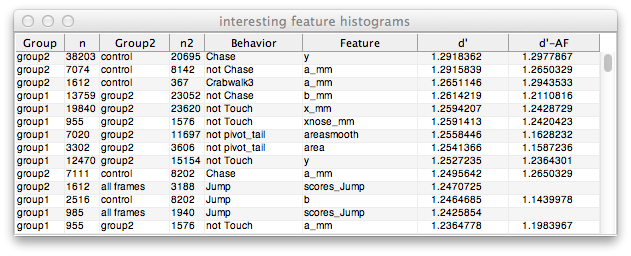
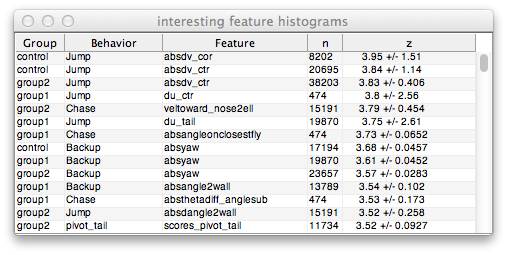
A table of feature histograms which are most different can be created to help in finding effects of experimental manipulations.
Click on the Interesting Feature Histograms button and set the following parameters:
Click on the Plot button. And wait. For a while.
Selecting a cell in the d' or z column of the table plots the corresponding histograms. Select cells in any other column to retain or delete similar rows.
The results are saved in most_recent_table.csv, as well as stored in most_recent_config.mat upon exiting JAABAPlot. The are also cached in memory, which is cleared if any changes are made to the group list, experiment lists, style, individuals, or parameters.